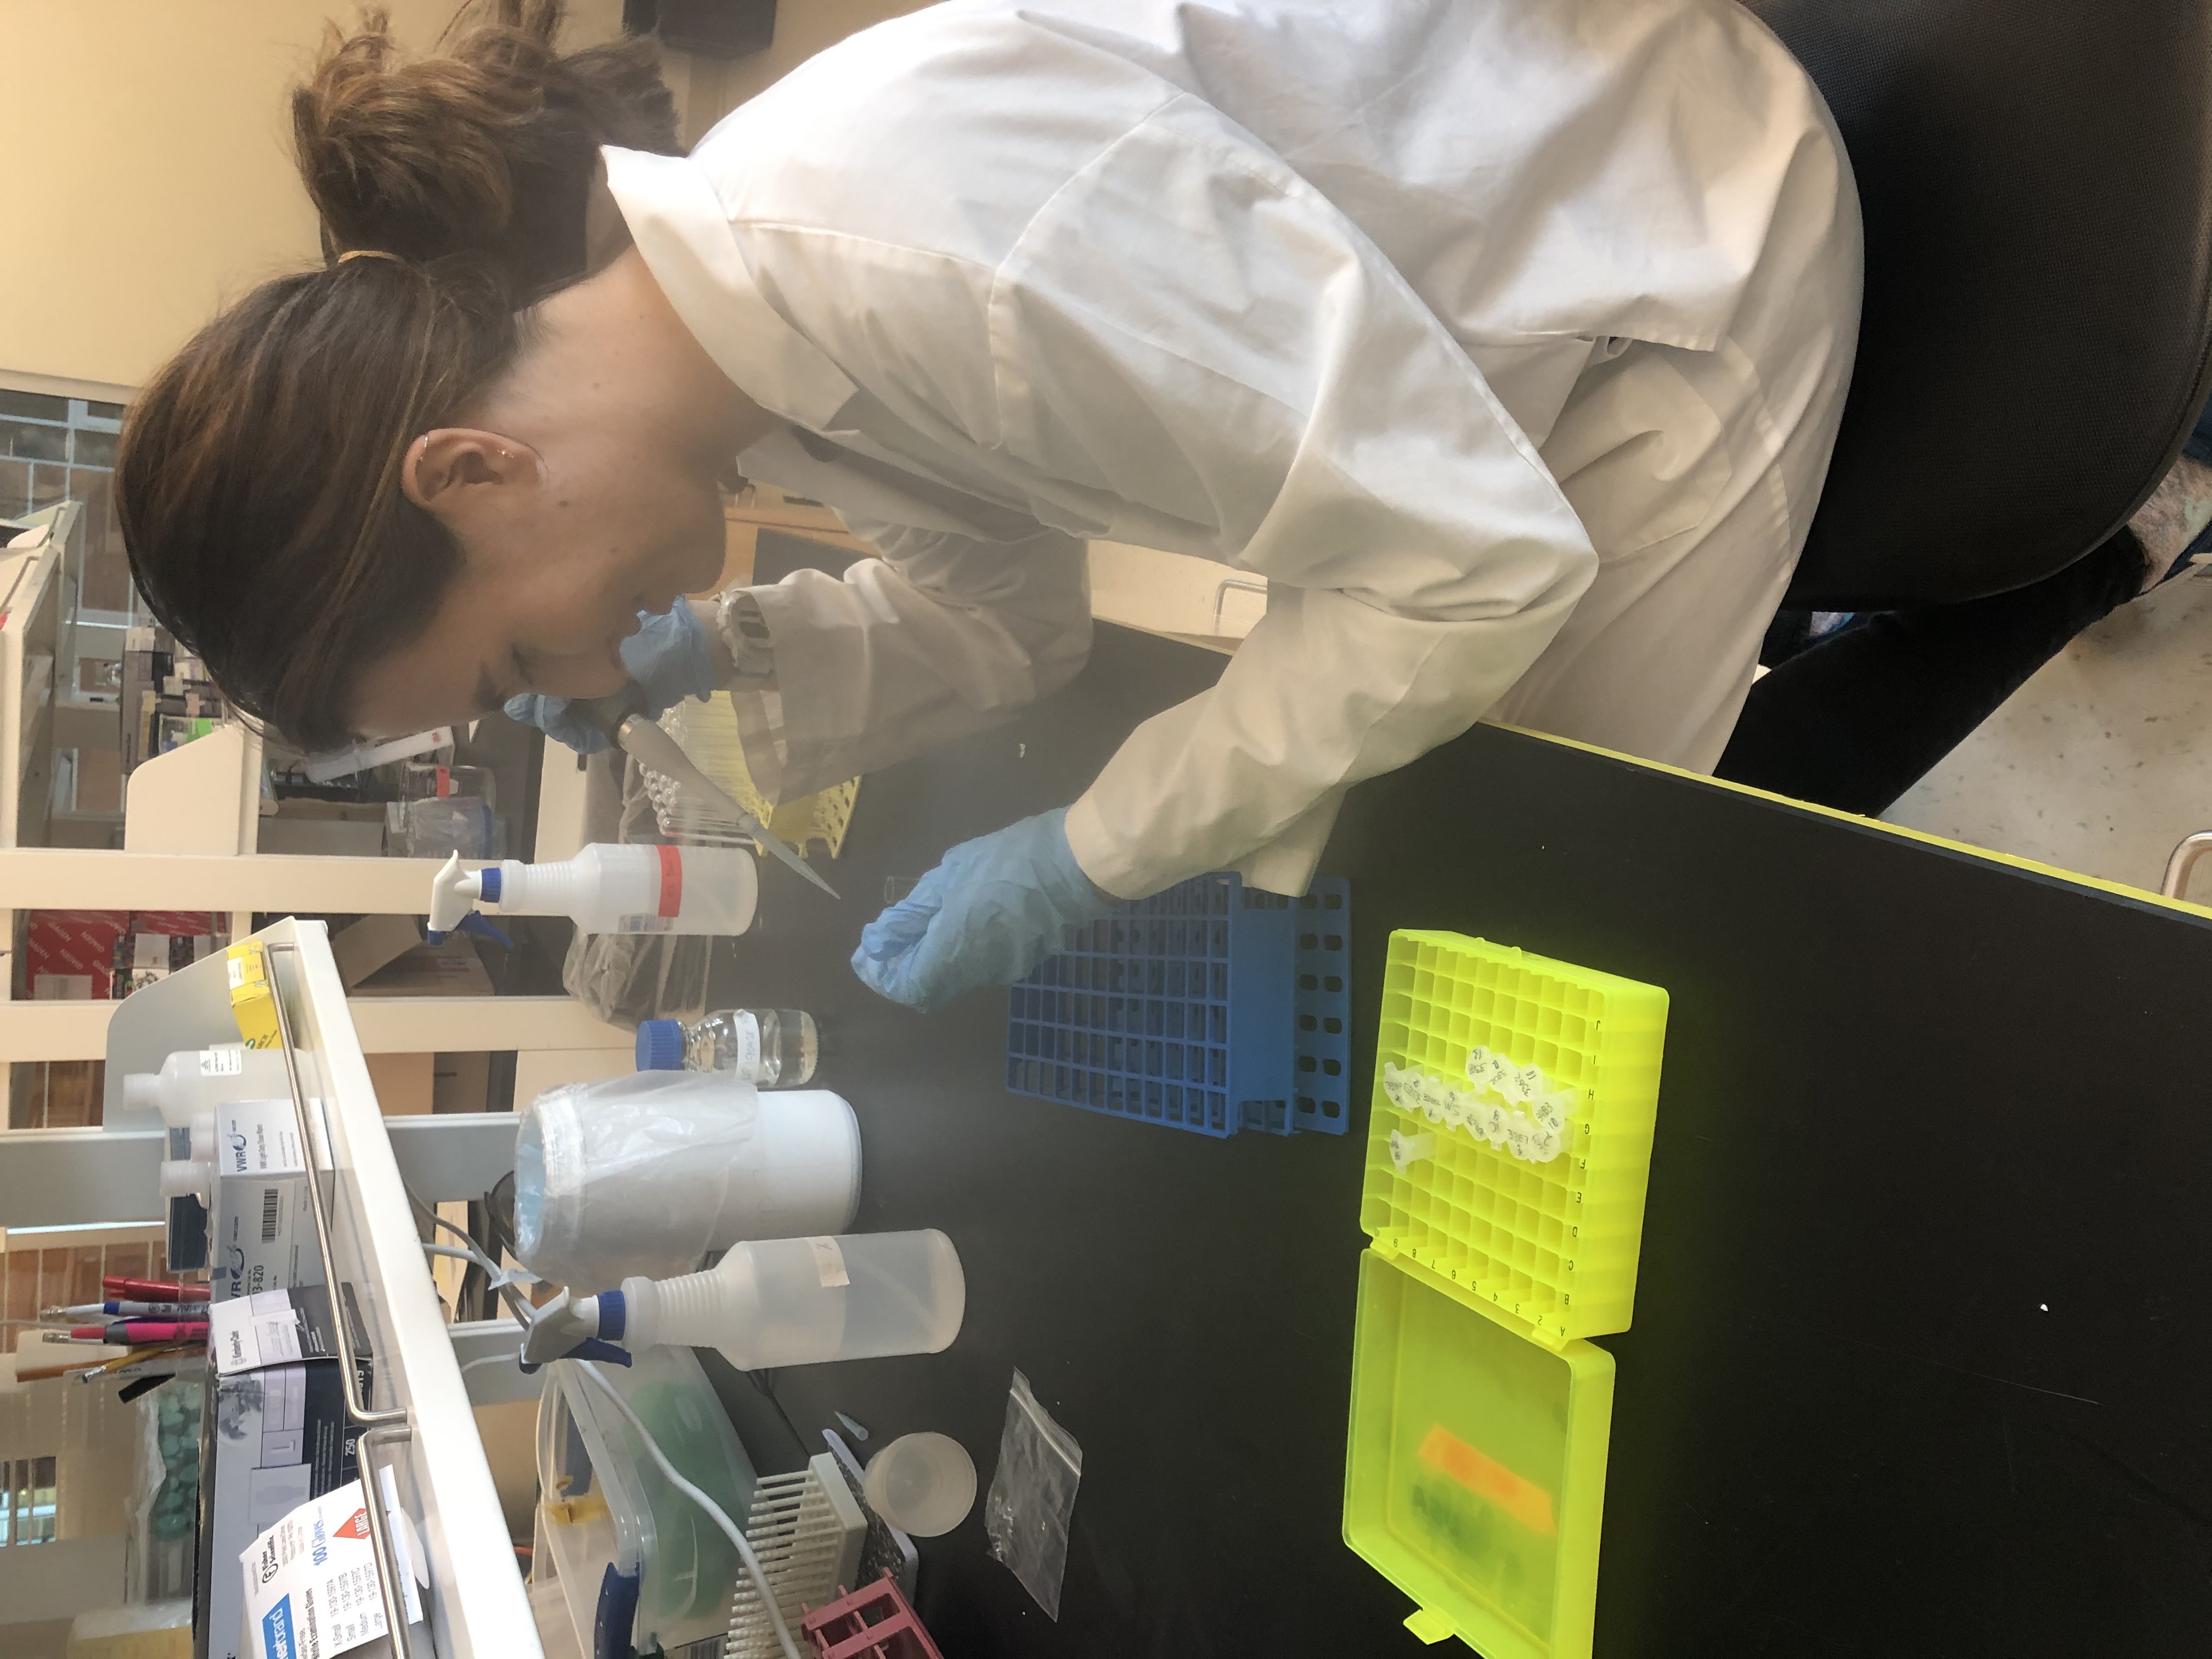
PRJ002AiptasiaMM flow cytometry sample preparation and testing
Objective:
To test and setup up sampling procedures for Flow cytometry to obtain symbiodiniacae counts and potentially also live and dead bacteria counts.
Protocol
Sample Preparation: Anemones were homogenized using the pestle motor in 250ul of FAASW in a 1.5ml tube. an additional 250ul of FAASW was added to the sample and vortexted. next 250 ul of sample was aliqouted into a lysing matrix tube and 70ul was aliquoted into an eppendorf tube to be used for DNA extraction and CFU counts respectively.
to the remaining 180ul of sample, 20 ul of .1% SDS solution was added. At this point sample sample can be frozen at - 80C, however we tested out the flow cytometry procedure day of. to prepare for flow cytometry, samples should be diluted 100 fold then needle sheared with a 25G needle. we tested varying dilutions (0, 10, 100, 100) on the platform and found the the 100 fold to be most appropriate.
Flow Cytometry was run on a BioRad ZE5 analyzer. to test bacterial counts diluted samples were treated with 1ul of 5micromolar working concentration for both DAPI and Syto9 dyes. however we found that tissue autfluorescence interefered to much with these channels to get clear readings so going forward we will not use dyes and only use flow to quantify algal density.
BioAnalyzer Settings
- chlorophyll 1 shoud be set at 593/52
- chlorophyll 2 should be set at 692/80
- After naming the plate and sample wells make sure the following setting are selected:
- agitation is on
- samples will be returned
- volumetric counting should be turned on
- Sample volume should be set to 100ul rate should be set to 1.5ul
Setup up preliminary axes in the gates section
- Chlorophyll2 vs. FSC
- Chlorophyll 1 vs. FSC
- SSC vs. FSC
Here you can run a preliminary set of samples to pre set your gates or you can wait to set them up in the analysis software When you’ve finished setting up change over to Acquisition mode and let your plate/ tubes run.
# Analyzing Samples in FlowJo
After logging in, drag the samples which you exported from the anlyzer into the program. If you have pre drawn gates check them against the samples to make sure they seem to fit the parameters. If you havent’ drawn your gates yet use the polygon feature to draw anew gate. Your first gate should elimanate off-axis data and should encircle almos all events. Drag this gate up to the top to apply to all samples. Next draw you subgate that around your target population. Apply this gate to all samples, and check through to ensure they look reperesentative based on the captured events. Once you are happy with your gates use the Layout editor ( L button in the top editor bar) to obtain all your plots. You can also export a table with your event counts for downstream calculations.
